17 Aug 2026
Transcontinental Itineraries Reshaping Performance Lines in Tennis, Rugby, and Basketball

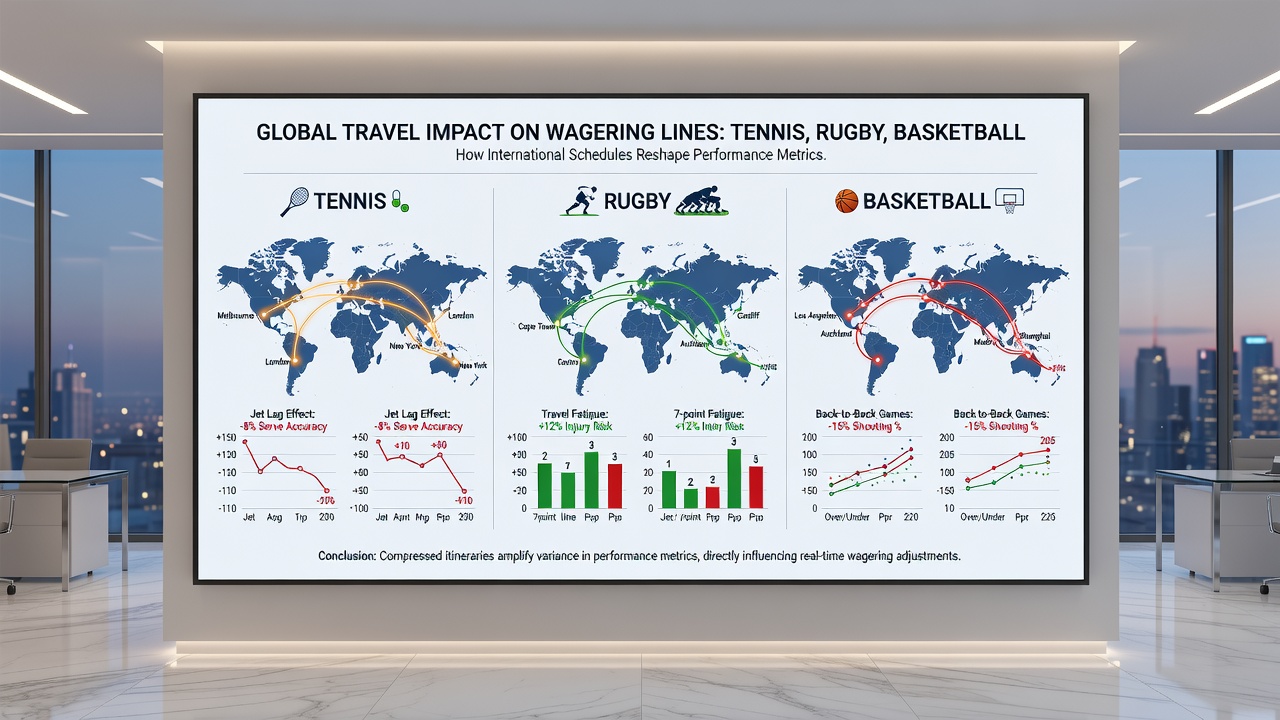
Professional circuits in tennis, rugby, and basketball feature packed calendars that send competitors across multiple time zones within short windows, and these movements create measurable shifts in performance metrics that betting markets track closely. Data from sports science programs indicate that jet lag and recovery demands alter win probabilities, point differentials, and scoring rates in consistent patterns across these disciplines.
Time Zone Adjustments in Tennis Tours
Tennis players often move between continents for consecutive Grand Slam events and ATP or WTA tournaments, with schedules that compress recovery periods into a matter of days. Studies compiled by the International Tennis Federation show that eastward travel of more than six hours correlates with reduced first-serve percentages and higher unforced error counts during the first 48 hours after arrival. Observers note that these statistical dips appear in historical match data, prompting oddsmakers to adjust set totals and player props accordingly.
August 2026 brings the US Open hard-court swing immediately after European clay events, forcing a rapid switch from slower surfaces and earlier start times. Analysts at major sportsbooks have recorded instances where players crossing from Paris to New York see their implied win probabilities drop by 4 to 7 percentage points in early-round matches when historical travel-adjusted models are applied. Line movement in these windows tends to stabilize once additional public data on practice sessions becomes available.
Rugby Travel Demands Across Hemispheres
Rugby union and league competitions, particularly those involving Super Rugby and international tests, require teams to cover long distances between southern and northern hemisphere venues. Research published in the Journal of Sports Sciences highlights that teams traveling westward experience slower reaction times in contact situations during the initial 72 hours, which translates into fewer dominant tackles and reduced meters gained per carry. These patterns feed directly into handicap and total points markets.
During the 2025-2026 season, several Pacific Island nations scheduled mid-year tours that included back-to-back fixtures in Europe followed by return legs in Oceania. Figures released by World Rugby indicate elevated penalty counts in matches played within 48 hours of arrival, a factor that influences over/under lines on set-piece outcomes. Bettors tracking these fixtures often see early lines move as roster announcements confirm travel rosters and medical updates.
Basketball Schedule Compression and Recovery
Professional basketball leagues such as the NBA and EuroLeague maintain calendars that intersperse domestic games with international windows and overseas exhibitions. Data maintained by the NBA Players Association reveal that back-to-back games following transcontinental flights produce measurable declines in three-point shooting efficiency and defensive rating. Sportsbooks incorporate these variables into live betting models that adjust spreads in real time during the first quarter of affected contests.
In August 2026, several national team preparation camps will occur ahead of FIBA qualifiers, requiring club players to cross multiple zones before returning to preseason training. Historical datasets from the past five seasons show that teams with the shortest recovery windows post-travel post lower average points in the opening month of the regular season. Market makers respond by shading totals downward until on-court evidence contradicts the travel-adjusted baseline.
Integrated Market Responses Across Circuits
Betting platforms aggregate travel data with performance analytics to generate dynamic lines that reflect documented recovery curves. When multiple athletes or teams converge on the same venue after similar flight patterns, correlated movements appear across tennis match totals, rugby try lines, and basketball player props. Regulatory bodies such as the Australian Sports Commission have published guidelines encouraging transparency in how such external factors enter pricing algorithms.
One documented case involved a 2024 tennis player who flew from Melbourne to Indian Wells and posted a statistically significant drop in return points won during the opening rounds. Similar patterns surfaced in rugby sevens squads returning from South American tournaments and in NBA teams completing a European preseason tour. These examples illustrate how operators update models with fresh inputs rather than relying solely on pre-travel form.
Conclusion
International travel schedules generate repeatable effects on physical output and statistical profiles in tennis, rugby, and basketball. Performance data collected across multiple seasons allow markets to embed recovery variables into opening lines and subsequent adjustments. As calendars for 2026 continue to evolve, these factors remain central to how wagering lines form and shift across the three circuits.